While demonstratives have become a staple of modern litigation, more graphics do not necessarily create a more persuasive case. The most effective demonstratives begin with a clear understanding of the “why” behind each visual and are tailored to the specific practice area, target audience, and venue.
In my 15 years of experience working with trial teams across a wide range of matters and venues across the country, I’ve learned that the most successful graphics are rarely the most elaborate. They are, instead, graphics that help decision-makers understand, retain, and connect with the most important aspects of the case.
While cases within the same practice area often share common elements, no two cases tell exactly the same story. One of the lessons I’ve learned is that effective visual strategies rarely emerge from a standard formula. Each matter presents its own themes, challenges, and nuances that should inform the visual strategy from the outset.
The goal is not simply to present information visually, but to transform complex facts and evidence into a clear, compelling, and persuasive visual narrative that advances the case theory. Regardless of the case, demonstratives should generally focus on three key elements: simplifying, clarifying, and persuading.
Designing Demonstratives for the Target Audience and Venue
In addition to understanding the details of the unique case, it is important to assess the target audience and gauge their level of understanding of the case background. Jurors often require the greatest degree of explanation when confronted with complex facts, technical concepts, or voluminous data. However, judges and arbitrators, though well-versed in legal issues, may also be unfamiliar with the more nuanced details of each case. While the sophistication of the graphic might differ, effective demonstratives remain essential for advancing arguments, clarifying complexity, and helping decision-makers retain key information.
How demonstratives are built should also differ depending on the type of trial. Bench trials and arbitrations are often guided by questions from judges or panels, so presentations are rarely linear. Demonstratives developed for these proceedings should generally have more interactivity between their components to give the presenter flexibility to move around the presentation. Demonstratives developed for jury trials, on the other hand, should be easily revised and adapted to respond to objections and decisions from the court.
Finally, it is also important to take venue into account when developing demonstratives for a jury. For example, the makeup of a jury in the Southern District of NY will differ greatly from one in the Northern District of Texas. Our vast experience working in different venues informs the development of graphics.
Visual Strategies by Case Type
In my experience, the most effective trial graphics are developed to address the specific challenges presented by a case. While no two matters require the same visual strategy, certain practice areas frequently benefit from particular types of demonstratives. The examples below illustrate how graphics can help transform complex evidence into clear and persuasive visual narratives across a range of litigation contexts.
WHITE COLLAR AND SECURITIES LITIGATION GRAPHICS
Few case types present greater communication challenges than white collar, securities, and other complex financial matters, where unfamiliar concepts and highly technical evidence can quickly overwhelm the trier of fact.
Another challenge in these cases is presenting vast amounts of complex information, including financial transactions, accounting records, and stock market activity, in a manner that is clear and accessible to jurors while preserving a sense of the underlying material’s complexity and sheer volume. To address these challenges, we recommend developing animated graphics designed to educate and persuade while keeping the audience focused on the presenter.
Animation is particularly important with complex financial demonstratives because giving the audience small bits of information at a time makes them more likely to retain it. Using a foundational slide with animation allows the presentation to unfold step by step, progressively introducing information while maintaining a consistent visual framework. Each click provides additional information, keeping the audience interested and alert.
One common mistake is beginning with the most complicated concept in the case. Instead, effective demonstratives establish a familiar foundation first and then build complexity incrementally. Once that baseline is established, build on the simple demonstrative to include the elements of the more complex financial term. This approach allows the audience to learn alongside the presenter, improving understanding, retention, and engagement.
Similarly, with voluminous data, we recommend developing concepts that show the slow build of the materials with icons and images that simplify the content. Once those icons and images have been established, the rest of the data and material can be introduced in a way that visually shows the volume while maintaining a simplified base.
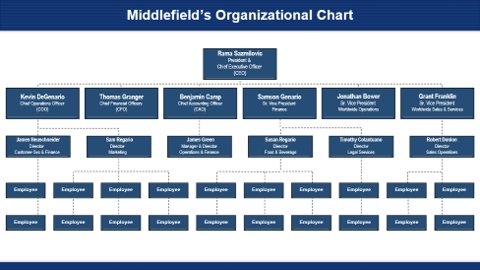
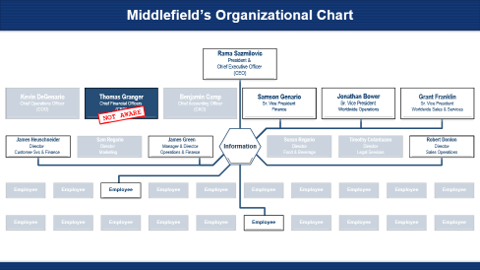
Finally, in complex financial cases, it is often beneficial for the audience to understand the relationships among the key players, entities, and events that make up the larger story. Organizational charts, transaction flows that highlight key participants, and timelines can depict these relationships and help humanize the parties involved.
COMMERCIAL, CONTRACT, AND EMPLOYMENT LITIGATION GRAPHICS
Commercial, contract, and employment cases carry similar challenges. Complex, voluminous information, such as different types of communications and corporate structures, needs to be presented in a visually compelling, simple, and persuasive manner.
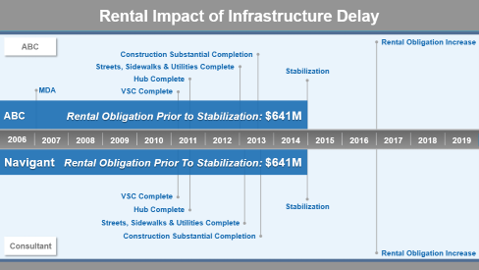
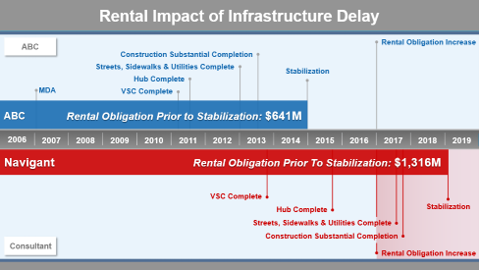
The facts at issue in these cases generally unfold over months or years, making chronology one of the most important elements of the case narrative. Establishing a clear chronology of facts is therefore critical to understanding. As a result, we recommend developing timelines and calendars of events to orient decision-makers to the facts of the case, while establishing a clear case chronology. These demonstratives will often include visual elements that further the key arguments, such as arrows to show passage of time, icons or images to identify categories within the timelines, and colors to highlight important dates.
In addition to chronologies, commercial, contract, and employment cases often involve many individuals, departments, and organizations; therefore, key players graphics and organizational charts are essential to clarify roles, responsibilities, and internal reporting structures. Additionally, organizational charts can often be animated and adapted to become hub-and-spoke graphics that show patterns of communication between different key players and organizations.
All cases require showing and highlighting documentary evidence for the decision-makers. However, these types of demonstratives are particularly important in commercial, contract, and employment cases where contract language and provisions will influence deliberations and final verdicts. Instead of solely developing contract document callouts, utilizing animation to visually add or remove language that would be necessary for the other side’s case to be true can be particularly persuasive.
PATENT IP AND ITC LITIGATION GRAPHICS
In patent, IP, and ITC matters, 3D graphics can make highly technical concepts tangible, helping audiences visualize technologies and processes that may otherwise be difficult to understand. They can also show how different elements work together.
As mentioned above, taking venue into account when developing graphics is important and these types of matters often occur before Chancellors. As a result, demonstratives should be tailored to a more sophisticated audience by creating higher-level concepts that focus on complex information, rather than beginning with simpler concepts.
Technology tutorials are essential in these types of cases to clearly establish the parameters around the technology and products at issue. As these tutorials tend to be very detailed and deal with complex technical concepts, we generally work directly with both the trial team and the expert to ensure the accuracy of the depictions. Technology tutorials consist of a mix of document and patent callouts, 2D demonstratives of the patent figure, and more complex, sometimes 3D demonstratives depicting the technologies.
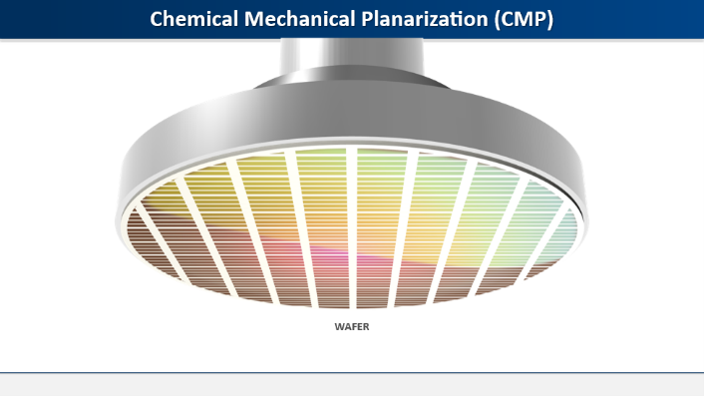
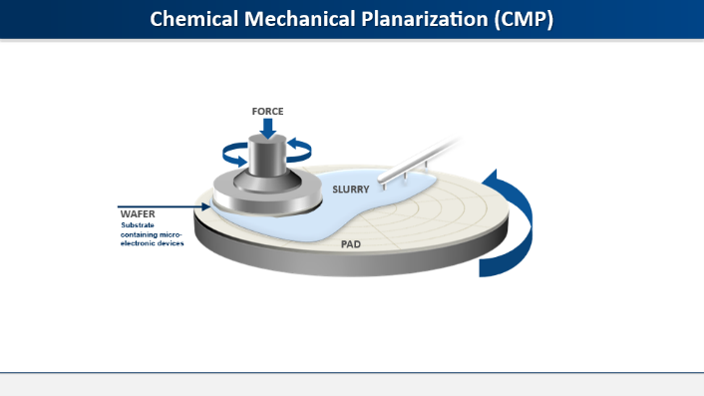
To prove or disprove product infringement, it is essential to connect the patents at issue directly to the accused product. Because patents are often dense and filled with technical language, claim-element checklists, side-by-side comparisons, and annotated product images can show where each claimed element appears in the product or can highlight an element that is missing. These visuals help turn complex patent language into a clear infringement or non-infringement analysis. Additionally, overlaying images on patent figures can be particularly effective at bringing a dense and complex image to life.
ANTITRUST LITIGATION GRAPHICS
Antitrust cases often require counsel to explain market dynamics, business relationships, and competitive effects that are not immediately apparent from documents alone. Thoughtfully designed flow diagrams can help make these relationships visible and understandable.
Market share and market definition demonstratives are key in defining the relevant market and establishing whether a specified group falls within or outside the defined market. These demonstratives can take many forms, including pie charts, bar charts, Venn diagrams, and geographic maps, but their shared goal is to clearly establish the market and market participants.


In complex antitrust cases, relationship flow charts aid in establishing competitors’ illegal actions such as price-fixing, bid-rigging, and exclusionary anticompetitive agreements and should be tailored to the specific case details to ensure their efficacy. Additionally, monopoly power demonstratives depicting their negative effects are effective in showing decision-makers how a monopoly can affect their day-to-day lives, including higher prices, lower quality, fewer choices, and barriers to entry for potential competitors. Alternatively, these demonstratives can clarify how a proposed merger would benefit consumers and the broader public by improving access, quality, efficiency, and innovation.
Finally, in antitrust cases, economic experts rely on graphics to translate complex analyses into clear visual stories. Charts and progressive visuals can explain pricing trends, competitive constraints, product substitution, barriers to entry, and damages, while before-and-after comparisons can show how conduct or a proposed transaction may change the competitive landscape.
CONSTRUCTION OIL AND GAS AND ENERGY LITIGATION GRAPHICS
Construction, oil and gas, and energy disputes often involve highly technical subject matter and geographically complex facts. Visuals can help bridge the gap between expert knowledge and audience understanding.
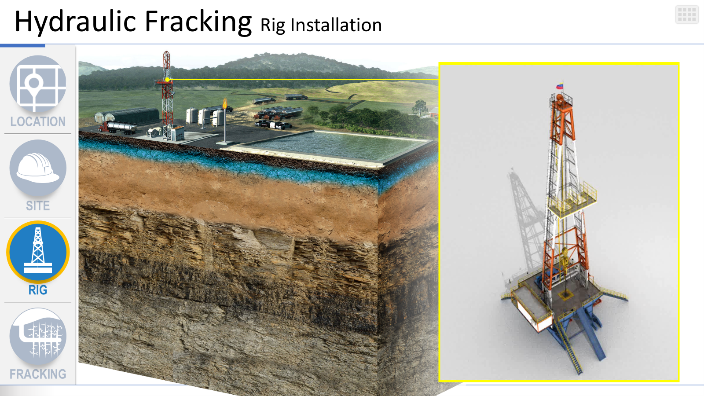
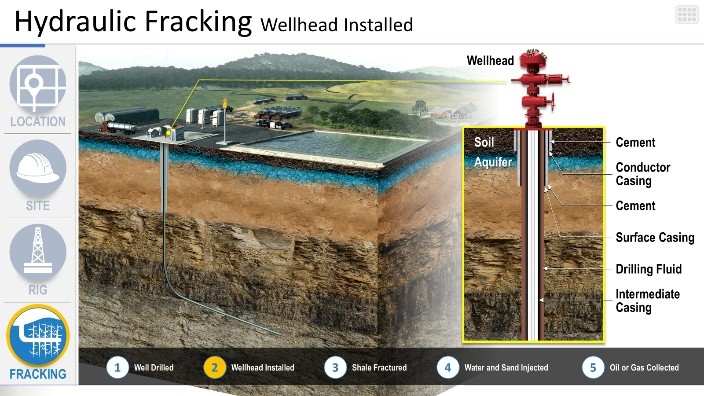
Geological models, cross-sectional land demonstratives, and 3D terrain reconstructions are essential to show decision-makers what they would not be able to see otherwise. Often working directly with experts, we have developed land and sea oil rigging demonstratives, a 3D model of a train tunnel, soil compaction and land reclamation demonstratives, and a 3D model of a sports stadium, among many others, all of which were essential in explaining the specific details and nuances of their corresponding cases. In complex construction disputes, an overhead site model can also provide critical context by clearly illustrating site access, logistical bottlenecks, work areas, and the locations of key facilities
Additionally, as with contract disputes, construction, oil and gas, and energy matters have important timing factors that need to be clearly understood by the audience. For example, construction timelines depicting promised versus actual completion dates are effective in visually showing clear construction delays. Combining chronologies with 3D concepts is also helpful to depict how a construction project or failure developed over a specified period of time.
Finally, maps and demonstratives built on top of blueprints assist in bringing flat images to life and to clarify their content for decision makers.
Testing Trial Graphics Through Pretrial Research
I’ve seen graphics that seemed highly effective during development generate confusion when presented to a test audience, and I’ve seen relatively simple visuals become powerful persuasive tools once they were refined through research. Additionally, I have seen similar concepts presented to juries from different venues have differing effects as a result of the distinctive jury pool makeup.
For that reason, we strongly recommend evaluating demonstratives through pretrial research before stepping into the courtroom. Even thoughtfully designed graphics can produce unexpected reactions from the intended audience. Research findings provide an opportunity to refine the visual strategy, strengthen persuasive themes, and identify opportunities for improvement before those visuals are presented at trial.
This refinement should return to the purpose of each graphic: simplifying complex facts and evidence, clarifying case themes, and persuading the intended audience. The findings can help counsel assess how well the demonstratives serve those purposes and where further refinement is needed.
While the practice area provides a useful starting point, the most effective demonstratives are never selected from a template. They are developed through a thoughtful understanding of the case, the audience, and the venue. When designed with a clear strategic purpose, demonstratives do more than illustrate information. They help transform complex evidence into a persuasive visual narrative that supports the broader trial strategy.