May 23, 2026

Predicting Liability Decisions: The Importance of Juror Characteristics and Perceived Case Strength

A five-year empirical analysis of more than 2,000 mock jurors across 64 civil case research exercises, this report examines how juror demographics, pre-deliberation leanings, and perceived case strength shape liability decisions. The findings reveal that while gender and socioeconomic status influence juror predispositions, the strongest predictor of liability outcomes is perceived case strength, underscoring the importance of effective trial strategy and case presentation in civil litigation.

Download Report

Introduction

The DOAR Research Center compiled data from a collection of focus groups and mock trials for civil cases that we conducted between January 2020 and December 2025. This includes data on over 2,000 focus group participants and mock jurors (N = 2,125) across 64 research exercises. The goal was to identify broad patterns in juror characteristics in civil cases—that is, what characteristics are generally associated with favoring one side over the other.

We used predictive statistical models to identify which juror characteristics most strongly predicted two key outcomes: jurors’ initial leanings[1], and their final liability decisions. Our results painted a clear picture of the types of jurors who consistently favor the defense in civil cases. We also examined how jurors’ initial leanings relate to their final decisions about liability, and the extent to which perceived case strength[2] predicts their final decisions. We review our findings for each of these below.

National Research Footprint

A stylized map of the United States showing the geographic distribution of study participants by state. Most states are displayed in a muted blue color, while five states are highlighted in a contrasting reddish tone to indicate locations with notable sample representation. California is highlighted on the west coast with a labeled value of 27.2 percent. In the northeastern region, New York is highlighted with the largest value at 35.8 percent. Nearby states Massachusetts (10.9 percent), Connecticut (4.0 percent), and Delaware (4.7 percent) are also highlighted and labeled. Each highlighted state is annotated with its name and percentage, with leader lines pointing from the labels to the corresponding state on the map. The remaining states are not individually labeled or quantified. The visual emphasizes that the largest portions of the sample come from New York and California, with smaller but meaningful representation from Massachusetts, Delaware, and Connecticut, and comparatively less representation from other regions.

Our Sample

The selected research events (i.e., focus groups and mock trials) took place across the country, with the largest samples drawn from New York (35.8%), California (27.2%), Massachusetts (10.9%), Delaware (4.7%) and Connecticut (4.0%). For each event, participants were recruited to proportionally mirror the demographic characteristics of the jurisdiction. This resulted in an exceptionally diverse group of jury-eligible participants in our combined dataset. Our sample was evenly split between men (49.8%) and women (48.5%), with 46.6% under 45 years old and 54.4% 45 years or older[3].

The sample was well divided across racial and ethnic groups, with 33.8% identifying as White, 22.9% as Asian, 21.9% as Hispanic/Latino, 17.4% as Black, and 3.8% as other. Educational and economic backgrounds were similarly diverse, with about half (50.2%) holding bachelor’s degrees and ranging from income brackets below $50,000 annually (21.2%) through $250,000 annually (6%). Political affiliations also varied widely, with a majority identifying as Democratic (52.0%), Republican (18.2%) or Independent (21.3%).

Key Findings

Juror Characteristics

Across the board, two traits consistently predicted jurors’ decisions: gender and socioeconomic status[4] (SES). Even after controlling for other demographic factors,[5]  gender was a reliable predictor of case leanings (p = .015)[6]. Men were consistently more likely to be defense-leaning than women (Men: M = 3.55; Women: M = 3.38)[7].

Column chart titled “Leanings by Gender.” The vertical axis shows leaning scores ranging from 3.00 to 4.00 on a 6-point scale where 1 represents strongly favoring the plaintiff and 6 represents strongly favoring the defense. Two columns are displayed: Males with a mean leaning score of 3.55 (95% confidence interval: 3.35 to 3.76), and Females with a mean leaning score of 3.38 (95% confidence interval: 3.18 to 3.58). Each column includes error bars representing the 95% confidence interval. Males lean slightly more toward the defense than females.

Socioeconomic status (SES) was also a significant predictor of juror leanings (p < .001).[8] High SES jurors (i.e., wealthier and more educated jurors) were more likely to lean toward the defense. Controlling for other demographics, jurors with the lowest SES (generally high school education level, making less than $50K annually) were the most plaintiff-leaning (M = 3.38), followed by those with average SES (generally bachelor’s level education, making $50-99K annually) (M = 3.46) and those with the highest SES (generally graduate degrees with household incomes of $150K or more) (M = 3.55), reflecting a pattern of increasing support for the defense as wealth and education rise.

Column chart titled "Leanings by Socioeconomic Status (SES) Level." The vertical axis shows leaning scores from 3.00 to 4.00 on a 6-point scale where 1 represents strongly favoring the plaintiff and 6 represents strongly favoring the defense. The horizontal axis categorizes jurors into three SES groups. Low SES (high school education, income below $50,000) has a mean score of 3.38 (95% CI: 3.17 to 3.58). Mid SES (bachelor's degree, income $50,000 to $99,000) has a mean score of 3.47 (95% CI: 3.28 to 3.66). High SES (graduate degree, income $150,000 or more) has a mean score of 3.56 (95% CI: 3.35 to 3.76). Each column includes error bars representing the 95% confidence interval. The chart shows a pattern of increasing defense-leaning as socioeconomic status rises.

When we examined SES and gender together, a meaningful interaction emerged. The overall effect of SES on case leanings was driven primarily by men (p = .009)[9]. As men became wealthier and more educated, they tended to lean more toward the defense, but women’s views stayed stable regardless of their SES. In other words, differences between men and women are small among lower SES jurors but widen substantially among higher-SES jurors. Gender may therefore be a particularly important factor important to consider in higher-SES jury pools.

Line chart titled “Leanings by SES and Gender.” The vertical axis shows leaning scores from 3.00 to 4.00 on a 6-point scale where 1 represents strongly favoring the plaintiff and 6 represents strongly favoring the defense. The horizontal axis has three categories: Low SES, Average SES, and High SES. Two lines are plotted. The male line (green) starts at 3.37 for Low SES, increases to 3.55 for Average SES, and rises to 3.74 for High SES, showing a strong upward trend toward the defense as SES increases. The female line (terra cotta) remains essentially flat at 3.38 for Low SES, 3.38 for Average SES, and 3.37 for High SES. The chart illustrates that the overall SES effect on juror leanings is driven primarily by men, with gender differences widening substantially at higher SES levels.

Notably, these findings hold true even when we account for variability between individual research events. This means that gender and SES predict jurors’ initial leanings even in different types of civil cases. We also discovered that gender and SES predict jurors’ final, post-discussion or post-deliberations decisions about liability. This is unsurprising given that jurors’ initial leanings typically predict their final decisions about liability, as described below.

Jurors’ Initial Leanings as Predictors of Final Decisions About Liability

We examined whether jurors’ initial leanings predict their post-discussion (i.e., final) decisions about liability.[10] As we would expect, jurors’ leanings strongly predicted their final liability decisions (p < .001)[11]. The more defense-leaning the jurors were before group deliberations, the less likely they were to ultimately find liability. Conversely, the more plaintiff-leaning the jurors initially were, the more likely they were to find liability.

As shown in the figure below, each one-point increase in leaning towards the defense relative to the group average reduced the odds of a liability vote by nearly half (OR ≈ 0.48).  Stated differently, each one-point decrease in leaning towards the defense relative to the group average (and therefore perceiving the plaintiff’s case as stronger) more than doubled the odds of finding liability (OR ≈ 2.07).

Spline chart titled "Predicted Probability of Liability by Initial Leaning (Within Group)." The horizontal axis represents a juror's initial leaning relative to their group's mean, ranging from negative 4 (more plaintiff-leaning than peers) to positive 4 (more defense-leaning than peers). A dashed vertical line at 0 marks the group average. The left side is labeled "Below group average (leans less defense than peers)" and the right side is labeled "Above group average (leans more defense than peers)." The vertical axis shows predicted probability of liability from 0% to 120%. A smooth black curve descends from approximately 97.8% at negative 4 to approximately 12.2% at positive 4, following a sigmoid pattern. The curve crosses 50% probability near a relative leaning of approximately positive 0.8. A shaded terra cotta band surrounds the line, representing the 95% confidence interval, which is narrowest near the center of the data and widens toward the extremes. The chart demonstrates that each one-point shift toward the defense relative to peers roughly halves the odds of a liability finding.

Among jurors who initially leaned towards the defense, 81.9% found no liability, compared to only 18.1% of plaintiff-leaning jurors who found no liability. In contrast, 73.1% of jurors who initially leaned towards the plaintiff found full liability, compared to only 26.9% of defense-leaning jurors who found full liability. This indicates that jurors’ individual opinions are highly predictive of how they will vote in a group (i.e., during deliberations). At the same time, these results also demonstrate that jurors’ opinions can be swayed by group discussions, as evidenced by the fact that approximately one in four defense-leaning jurors found full liability after discussions (i.e., 76.3% defense-leaning found no liability compared to 23.7% who found full liability), and approximately one in five plaintiff-leaning jurors found no liability after discussions (i.e., 79.3% of plaintiff-leaning jurors found full liability compared to 20.7% found no liability).

Perceived Case Strength

Finally, we examined how much the overall strength of the defense’s case predicts jurors’ final decisions about liability. Case strength was measured by averaging jurors’ leanings across a particular research event. We found that case strength was a powerful predictor of liability (B = −2.08, p < .001).[12]  Each one-point increase in perceived defense strength reduced the odds of finding liability by nearly 90%. In other words, while jurors’ case leanings were shaped by their demographics, their final decisions were highly sensitive to the overall strength of the evidence. No matter who the jurors are, one of the most important factors in determining liability is the overall strength of the case being put forward.

Column chart titled “Probability of Liability by Perceived Case Strength.” The vertical axis shows predicted probability of liability from 0.00 to 1.00. The horizontal axis categorizes perceived defense case strength into three levels based on group average leaning scores. Low defense strength (group average leaning of 2.84) has a predicted liability probability of 0.91 (95% CI: 0.85 to 0.94). Average defense strength (group average leaning of 3.52) has a predicted liability probability of 0.70 (95% CI: 0.61 to 0.77). High defense strength (group average leaning of 4.21) has a predicted liability probability of 0.36 (95% CI: 0.25 to 0.48). Each column includes error bars representing the 95% confidence interval. The chart shows that as the perceived strength of the defense case increases, the likelihood of jurors finding liability decreases substantially.

Moreover, perceptions of case strength—at both the individual juror level and at the group level—accounted for about 40% of the variation in liability judgements. This indicates that perceived case strength predicts liability judgments both across jurors and across different types of civil cases.

Importantly, once we accounted for perceived case strength, demographic differences no longer predicted liability (p = .087). However, demographics continued to predict jurors’ leanings, which in turn strongly predicted liability. Taken together, this suggests a mediation effect: demographic characteristics affect case outcomes indirectly by shaping how jurors interpret and evaluate the strength of the evidence.

Key Takeaways

Our results indicate that in civil cases—whether it’s intellectual property, employment, antitrust, contracts, securities, and so on—the people who are going to be the best defense advocates on the jury are often going to be the most like individual defendants or representatives (or witnesses) of the corporate defendants: men who are high SES.

We also see that jurors’ pre-discussion leanings are an important predictor of how they will ultimately determine liability, but that there is always room for people to be persuaded. This suggests that the best thing you can do for your case—and your client—is to arm your advocates with the tools necessary to convince their fellow jurors. Deliberations are an opportunity for jurors to change their pre-existing opinions, which they inevitably will have after the trial has ended and before they have discussed the case with others. But, as our analysis shows, people can change their minds. It is not written in stone.

The buck does not stop at jury selection, either. We found that the most important factor in predicting how you will fare is case strength. Yes, SES and gender matter—but only to a certain extent. Building a strong case—utilizing research to test and refine your case themes and see how they chalk up against the burden of proof and jury instructions—are critical for increasing your chances of success at trial.

[1]Jurors’ leanings are based on their pre-discussion and pre-deliberation individual opinions about the case, measured on a 6-point Likert scale from 1 strongly favors the plaintiff to 6 strongly favors the defendants. These are obtained after they have heard both sides’ presentations in the case but before they have discussed the case with others.

[2]Adding the group-level case-strength metric significantly improved model fit, χ²(1) = 44.27, p < .001.

[3]18-24 year olds (8.4%), 25-34 year olds (19.6%), 35-44 year olds (18.6%), 45-54 year olds (19.7%), 55-64 year olds (20.6%), and people older than 65 (12.8%).

[4]SES is a composite variable created by combining and then averaging z scores (standardized scores) of jurors’ education and household income, which, through factor analysis, we discovered mapped onto the same underlying dimension (i.e., SES).

[5]We controlled for SES, gender, race/ethnicity, political orientation, and political affiliation. We also created a variable to account for differences between research exercises (i.e., between different types of civil cases).

[6]B = 0.22, SE = 0.07, t(1804.85) = 2.44.

[7]Estimated marginal means with 95% confidence intervals (Men: M = 3.55, 95% CI [3.35, 3.76]; Women: M = 3.38, 95% CI [3.18, 3.58]).

[8]B = 0.22, SE = 0.06, t(1821.54) = 3.55.

[9]B = −0.23, SE = 0.09, t(1814.65) = −2.62.

[10]We tested this using multilevel logistic regression. Adding individual leanings measure to the demographic substantially improved model fit, χ²(1) = 311.42, p < .001.

[11]B = −0.73, SE = 0.05, z = −15.66, p < .001.

[12]SE = 0.27, z = −7.78, p < .001

Contributors
Eliana Aronson's Headshot

Eliana Aronson
Associate
Stay Informed
Stay up to date on our latest news and insights.
Subscribe
Explore Research Center
Report cover page showing young adult sitting at a desk in a dark room.
Mar 26, 2026
Public Attitudes About Liability for Suicides Committed After Chatbot Conversations

The DOAR Research Center found strong support for AI safety guardrails and reveals generational differences in attitudes toward chatbot accountability.

Read Now
Report cover showing a black and white photo of a warehouse with two people near a forklift tinted in a copper color.
Dec 2, 2025
The Impact of Occupation on Juror Attitudes Toward Technology and IP

The DOAR Research Center found that jurors’ occupations strongly influence how they view technology companies and intellectual property disputes.

Read Now
Report cover - photo of white house. The entire photo is in black in white but the four front columns are tinted with a copper color.
Jun 24, 2025
Public Attitudes Toward White-Collar Crime in the Aftermath of the Presidential Election

Following the 2024 presidential election, the DOAR Research Center conducted a national survey revealing a shift in how jurors view white-collar cases.

Read Now
Report Cover with image of Quantum Computer where the entire photo is in black and white but the computer is tinted with a copper color.
May 14, 2025
Juror Attitudes Toward High-Tech Companies in Patent Litigation

In a changing patent litigation landscape, the DOAR Research Center studied how jurors view high-tech companies across key venues.

Read Now
Report cover page showing an inside view of two buildings meeting at an inside corner. The entire photo is in black in white but the middle portion on left and right side is tinted with a copper color.
Dec 5, 2024
A Study of Jurors’ Attitudes Toward Theft of Trade Secrets Cases

The DOAR Research Center conducted a national study to understand how jurors evaluate trade secret disputes in today’s workplace environment.

Read Now
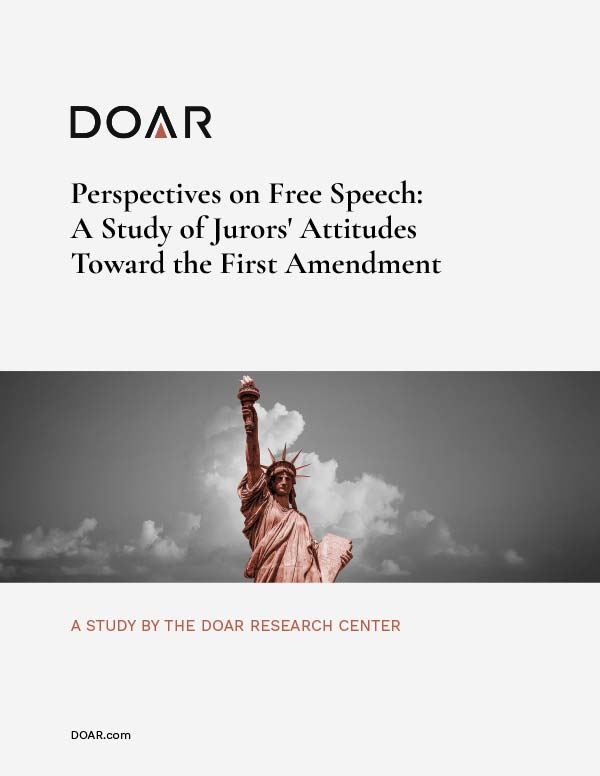
Report cover showing photo of statue of liberty where the entire photo is in black and white and the statue is tinted with a copper color.
Oct 31, 2024
Perspectives on Free Speech: A Study of Jurors’ Attitudes Toward the First Amendment

The DOAR Research Center examined how jurors respond to free speech arguments amid growing polarization and debate over the First Amendment.

Read Now
Report cover showing a black and white photo of a pill bottle and a glass of water on a table with a shadow being cast. The pill bottle has a copper tint to it.
May 14, 2024
A National Study of Community Attitudes Toward Pharmaceutical Companies

Amid growing concern over drug pricing and the opioid crisis, the DOAR Research Center studied public attitudes toward pharmaceutical companies.

Read Now
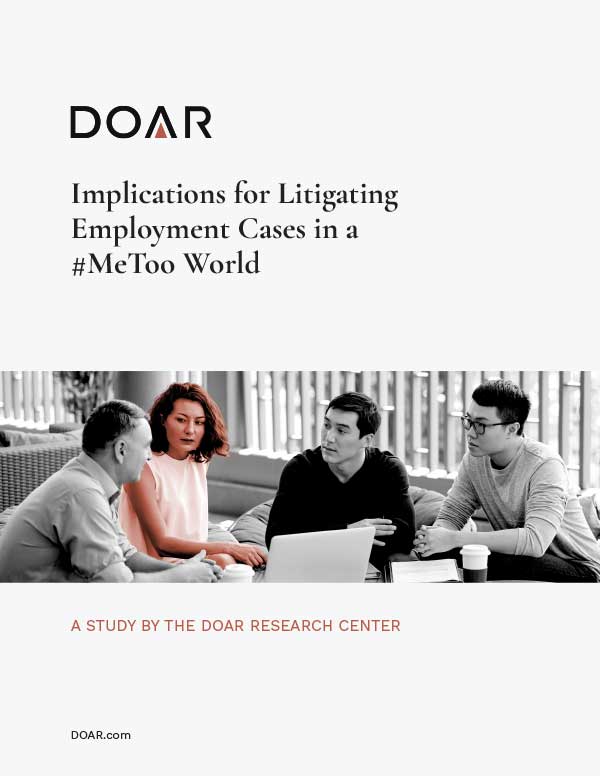
Report cover page showing people sitting in an office lounge area around a small table. There are three men and a woman. The entire photo is in black in white but the woman is tinted with a copper color.
Jun 25, 2020
Implications for Litigating Employment Cases in a #MeToo World

The DOAR Research Center examined how jurors approach workplace harassment and discrimination claims in the post-#MeToo era.

Read Now